65 and Older Population Grows Rapidly as Baby Boomers Age
Census Bureau Releases 2019 Population Estimates by Demographic Characteristics
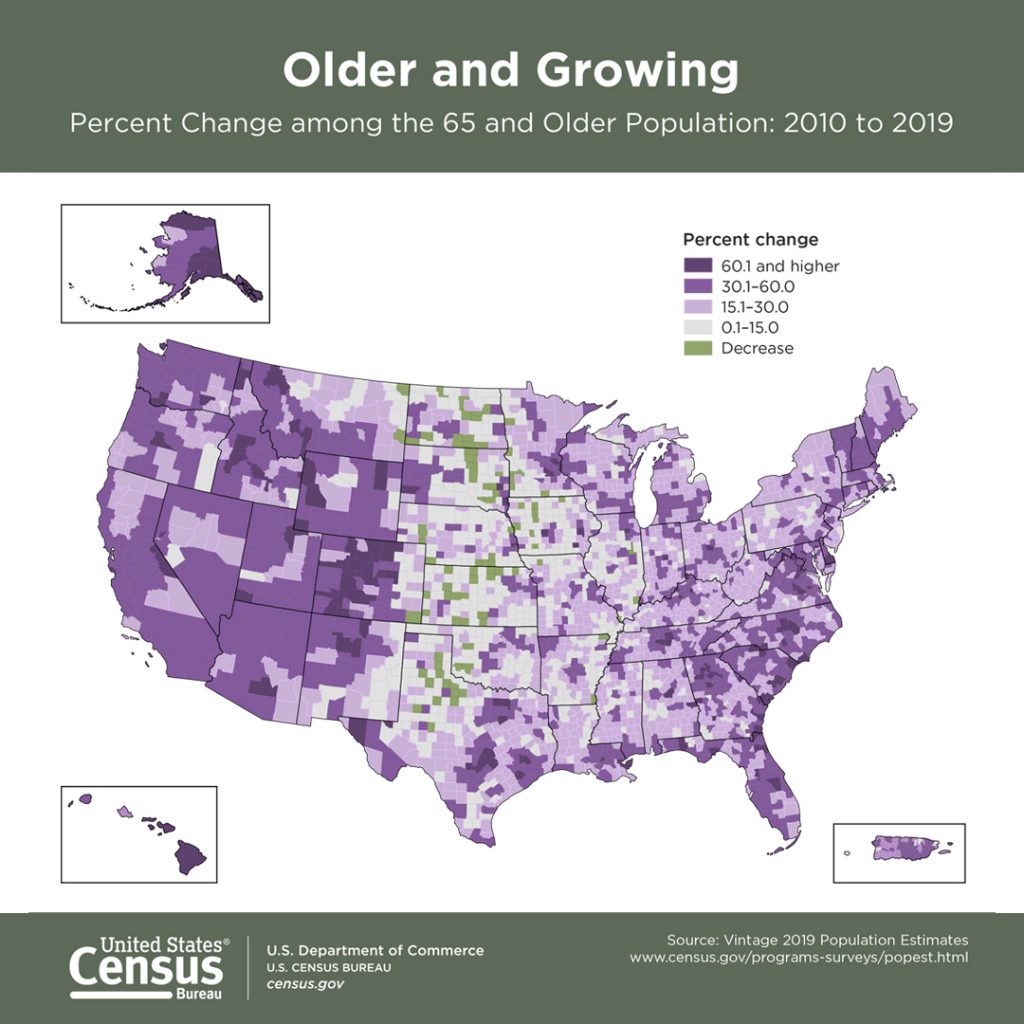
On June 25, 2020, the U.S. Census Bureau released estimates showing the nation’s 65-and-older population has grown rapidly since 2010, driven by the aging of Baby Boomers born between 1946 and 1964. The 65-and-older population grew by over a third (34.2% or 13,787,044) during the past decade, and by 3.2% (1,688,924) from 2018 to 2019. The growth of this population contributed to an increase in the national median age from 37.2 years in 2010 to 38.4 in 2019, according to the Census Bureau’s 2019 Population Estimates.
“The first Baby Boomers reached 65 years old in 2011,” said Dr. Luke Rogers, chief of the Census Bureau’s Population Estimates Branch. “Since then, there’s been a rapid increase in the size of the 65-and-older population, which grew by over a third since 2010. No other age group saw such a fast increase. In fact, the under-18 population was smaller in 2019 than it was in 2010, in part due to lower fertility in the United States.”
In 2019, over half (29) of the states had a median age older than 38.4 years, including all nine states in the Northeast. Eleven states were in the South, six were in the Midwest, and three were in the West. Since 2010, the nation’s under-18 population declined by 1.5%, from 74,182,279 to 73,039,150.
In 2019, one in five people in Maine, Florida, West Virginia and Vermont were age 65 or older. Maine had the largest share (21.2%) of population in that age group, followed by Florida (20.9%), West Virginia (20.5%) and Vermont (20.0%). Utah had the lowest percentage (11.4%) of population age 65 and older followed by Washington, D.C. (12.4%), and Alaska (12.5%). Utah also had the lowest median age (31.3 years) in 2019, up 2.1 years from 29.2 in 2010. North Dakota was the only state whose median age declined (1.7 years) between 2010 and 2019. In 2019, North Dakota’s median age was 35.3 years.
Of the 3,142 counties in the United States in 2019, 57.3% (1,799) had a median age between 40.0 and 49.9 years; 34.2% (1,076) had a median age between 30 and 39.9; 6.8% (215) had a median age 50 or older; and 1.7% (52) had a median age younger than 30 years. Between 2010 and 2019, the median age increased in 83.2% (2,614) of counties. During this period, the median age dropped in 15.9% (500) of counties and stayed the same in 28 or 0.9% of counties. In 2019, Sumter County, Florida, had the highest median age (68.1 years), and Madison County, Idaho, had the lowest median age (23.3 years).
A Changing Nation
As the nation has continued to gray, it has also grown more racially and ethnically diverse. References below to the race and ethnicity compositions are for race-alone-or-in-combination groups or Hispanics of any race unless otherwise specified.
The American Indian or Alaska Native Population
- The American Indian or Alaska Native population was 6,945,552 in 2019, growing by 806,930 (13.1%) since 2010.
- The median size of the American Indian or Alaska Native population in U.S. counties was 415 in 2019.
- In 2019, the median age for this population was 31.3 years, up from 28.8 in 2010.
The Asian Population
- The Asian population in the United States was 22,861,985 in 2019, representing an increase of 5,185,297 or 29.3% since 2010.
- The median size of the Asian population in counties in 2019 was 255.
- In 2019, the median age of the Asian population was 35 years, up from 32.9 in 2010.
- The Black or African American Population
- The national Black or African American population was 48,221,139 in 2019, representing an increase of 5,004,079 (11.6%) since 2010.
- The median size of the Black or African American population for counties in 2019 was 1,208 people.
- In 2019, the median age for the Black or African American population was 32.3, up from 30.6 in 2010.
The Native Hawaiian or Other Pacific Islander Population
- The Native Hawaiian or Other Pacific Islander population was 1,612,424 in 2019, up 21% or 279,895 since 2010.
- The median size of the Native Hawaiian or Other Pacific Islander population for counties in 2019 was 36.
- In 2019, the median age of the Native Hawaiian or Other Pacific Islander population was 29.6 years, up from 26.4 in 2010.
The White Population
- The White population was 258,646,488 in 2019, an increase of 10,570,492 (4.3%) since 2010.
- The median size of the White population for counties in 2019 was 22,417 people.
- In 2019, the median age of the White population was 39.5 years, up from 38.4 in 2010.
The Hispanic Population (Any Race)
- The Hispanic population was 60,572,237 in 2019, up 20% or 10,093,626 since 2010.
- The median size of the Hispanic population for counties in 2019 was 1,133 people.
- In 2019, the median age for the Hispanic population was 29.8 years, up from 27.3 in 2010.
Support community journalism
The first goal of the Ocala Gazette is to deliver trustworthy local journalism so corruption, misinformation and abuse are not hidden from the public or unchallenged.